Skeleton Key LiteSkeleton Key Lite Strategy
Note : Every input, except for the API Alerts, depends on an external indicator to provide the necessary values for the strategy to function.
Definitions
Strategy Direction: The trading direction (long or short) as determined by an external source, such as an indicator.
Threshold Conditions:
- Enter Condition: Defines the condition for entering a trade.
- Exit Condition: Defines the condition for exiting a trade.
Stop Loss (SL):
- Trail SL: A trailing stop loss, dynamically updated during the trade.
- Basic SL: A static stop loss level.
- Emergency SL (ER SL): A fallback stop loss for extreme conditions.
- Max SL: The maximum risk tolerance in stop loss.
- Limit SL: A predefined stop loss that is executed as a limit order.
Take Profit (TP):
- Max TP: The maximum profit target for a trade.
- Limit TP: A predefined take profit level executed as a limit order.
API Alerts:
- API Entry: JSON-based configuration for sending entry signals.
- API Exit: JSON-based configuration for sending exit signals.
Broad Concept
The Skeleton Key Lite strategy script is designed to provide a generalized framework for orchestrating trade execution based on external indicators. It allows QuantAlchemy and others to encapsulate strategies into indicators, which can then be backtested and automated using this strategy script.
Inputs
Note : All inputs are dependent on external indicators for values except for the API Alerts.
Strategy Direction:
- Source: Direction signal from an external indicator.
- Options: `LONG` (`1`), `SHORT` (`-1`).
Trade Conditions:
- Enter: Source input, trigger for entry condition.
- Exit: Source input, trigger for exit condition.
Stops and Take Profits:
- Trail SL: Enable/disable dynamic trailing stop loss.
- Basic SL: Enable/disable static stop loss.
- Emergency SL: Enable/disable emergency stop loss.
- Max SL: Enable/disable maximum risk stop loss.
- Max TP: Enable/disable maximum take profit.
- Limit SL: Enable/disable predefined stop loss executed as a limit order.
- Limit TP: Enable/disable predefined take profit executed as a limit order.
Alerts:
- API Entry: Configurable JSON message for entry signals.
- API Exit: Configurable JSON message for exit signals.
How It Works
Trade Logic:
- Conditions for entering and exiting trades are evaluated based on the selected input sources.
Stop Loss and Take Profit Management:
- Multiple stop loss types (trailing, basic, emergency, etc.) and take profit levels are calculated dynamically during the trade entry. Trailing stop loss is updated during the trade based on the selected input.
API Alerts:
- Alerts are triggered using customizable JSON messages, which can be integrated with external trading systems or APIs.
Trade Execution:
- Enter: Initiates a new trade if entry conditions are met and there is no open position.
- Exit: Closes all trades if exit conditions are met or stop loss/take profit thresholds are hit.
Key Features
Customizable: Fully configurable entry and exit conditions based on external indicators.
Encapsulation: Integrates seamlessly with indicators, allowing strategies to be developed as indicator-based signals.
Comprehensive Risk Management:
- Multiple stop loss and take profit options.
- Emergency stop loss for unexpected conditions.
API Integration: Alerts are designed to interface with external systems for automation and monitoring.
Plots
The script plots key variables on the chart for better visualization:
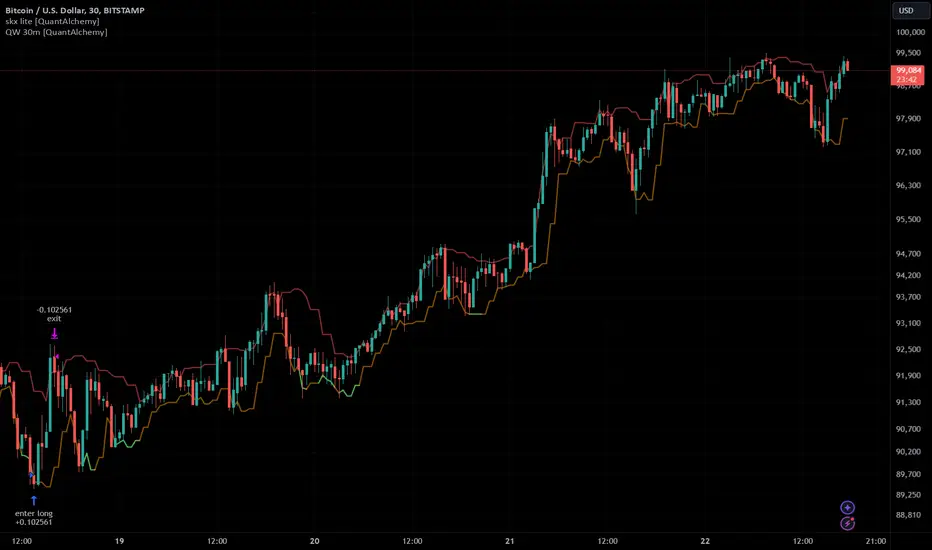
Enter and Exit Signals:
- `enter`: Displays when the entry condition is triggered.
- `exit`: Displays when the exit condition is triggered.
Risk Management Levels:
- `trailSL`: Current trailing stop loss level.
- `basicSL`: Static stop loss level.
- `erSL`: Emergency stop loss level.
- `maxSL`: Maximum risk stop loss level.
Profit Management Levels:
- `maxTP`: Maximum take profit level.
- `limitTP`: Limit-based take profit level.
Limit Orders:
- `limitSL`: Limit-based stop loss level.
- `limitTP`: Limit-based take profit level.
Proposed Interpretations
Entry and Exit Points:
- Use the plotted signals (`enter`, `exit`) to analyze the trade entry and exit points visually.
Risk and Profit Levels:
- Monitor the stop loss (`SL`) and take profit (`TP`) levels to assess trade performance.
Dynamic Trail SL:
- Observe the `trailSL` to evaluate how the trailing stop adapts during the trade.
Limitations
Dependence on Indicators:
- This script relies on external indicators to provide signals for strategy execution.
No Indicator Included:
- Users must integrate an appropriate indicator for source inputs.
Back-Test Constraints:
- Back-testing results depend on the accuracy and design of the integrated indicators.
Final Thoughts
The Skeleton Key Lite strategy by QuantAlchemy provides a robust framework for automated trading by leveraging indicator-based signals. Its flexibility and comprehensive risk management make it a valuable tool for traders seeking to implement and backtest custom strategies.
Disclaimer
This script is for educational purposes only. Trading involves risk, and past performance does not guarantee future results. Use at your own discretion and risk.
استراتيجية Pine Script®